An interactive visualization of multi-dimensional data in the H&E space
The "H&E2.0 Web Visualization" tool aims to fill a crucial gap in the realm of histopathology: the seamless integration of cellular and molecular information within Haematoxylin and Eosin (H&E)-stained tissues. H&E staining is the clinical gold standard for a wide array of disease diagnoses, offering a broad look at tissue landscapes, including features like tumors and margins. Immunohistochemistry (IHC) provides insights into specific protein biomarkers, while the more advanced technique of multiplex immunofluorescence (mIF) adds an additional layer of detail by highlighting multiple protein biomarkers at once. Yet, despite the rich data provided by these methods, no efficient mechanism currently exists to unify them, leaving clinicians with a fragmented view of tissue samples.
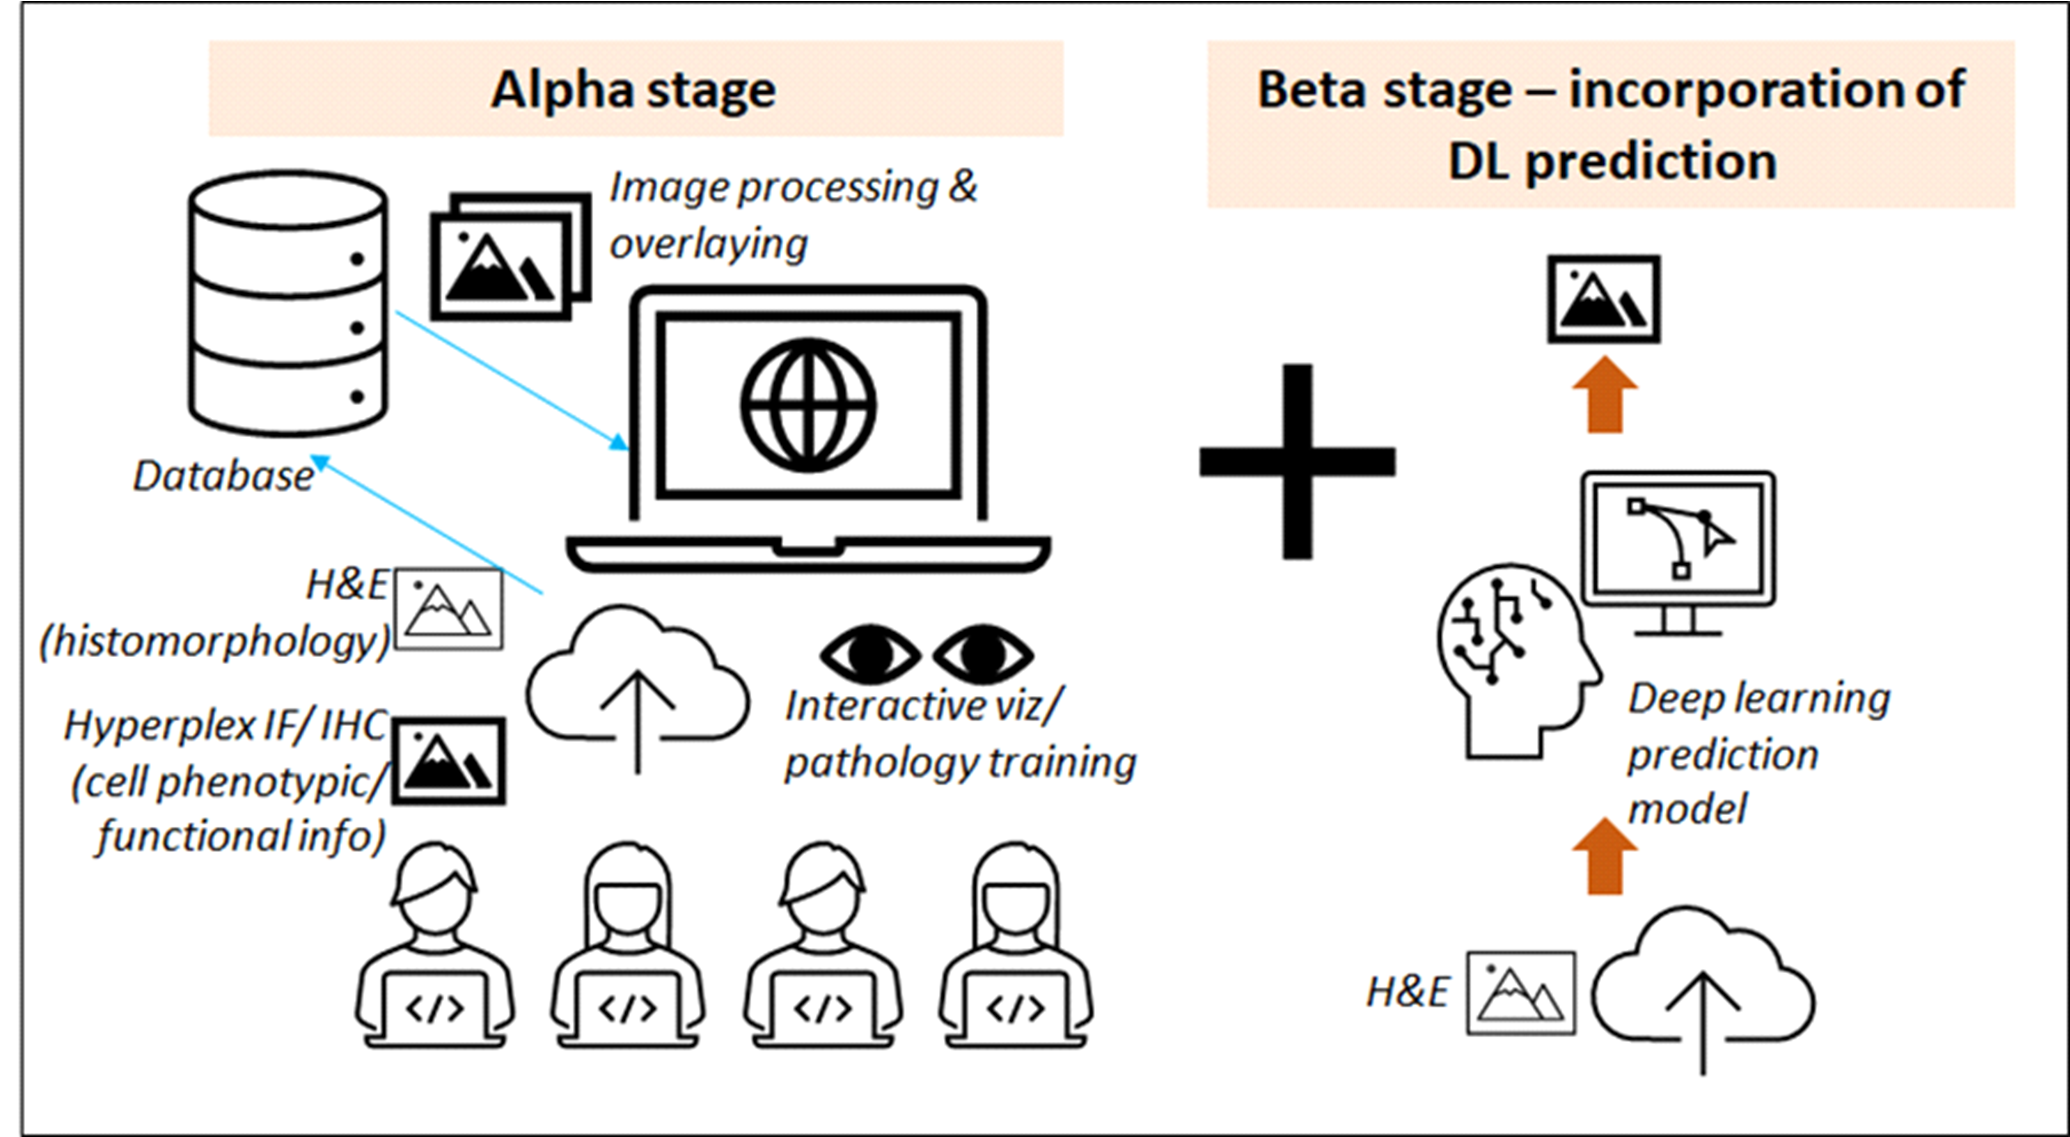
In today's clinical workflows, H&E images are first examined to gain an overall understanding of the tissue, followed by IHC and mIF imaging for molecular details. This segmented approach complicates the diagnostic process, making it both time-consuming and prone to errors, as it involves manually correlating spatial aspects across different types of images. To address this, our multidisciplinary team—including immunopathologists, bioinformaticians, and AI scientists—is developing an online platform for integrating H&E and IHC/mIF images. The tool is designed to enable a unified, more streamlined, and potentially more accurate diagnostic process.
Looking forward, the H&E2.0 Web Visualization tool has the potential to redefine how tissue analysis and diagnoses are approached. The platform promises not just to simplify diagnostic procedures, but also to provide a more holistic understanding of the relationships between tissue morphology and molecular markers. This integrated view could lead to more informed treatment decisions and even open up new avenues for research. As an added benefit, the tool is anticipated to serve as an effective training platform for pathologists. We are also planning to enrich the tool's capabilities by incorporating generative deep learning models, allowing users to virtually apply molecular or transcriptomic signals to H&E images for an even more comprehensive analysis.

Figure 1. Conceptual framework and future envisioning of H&E2.0 Web Visualization.